Stellar Leakage and Contrast#
This notebook covers the metrics that quantify how well the coronagraph suppresses the host star: raw contrast and core mean intensity. These determine the stellar leakage count rate in the ETC.
Theory#
Raw Contrast#
Raw contrast is the ratio of detected starlight to detected planet light:
Low contrast means the coronagraph effectively suppresses starlight.
Core Mean Intensity#
An alternative is \(\bar{I}_\star(r)\), the azimuthally averaged stellar intensity at separation \(r\), used for per-pixel ETC calculations.
ETC Usage#
ETC |
Method |
Formula |
|---|---|---|
EXOSIMS (primary) |
Core Mean Intensity |
\(C_{sr} = C_\star \cdot \bar{I}_\star \cdot \Omega / \theta_{det}^2\) |
EXOSIMS (fallback) |
Raw Contrast |
\(C_{sr} = C_\star \cdot C(r) \cdot \Upsilon_c(r)\) |
AYO / pyEDITH |
Core Mean Intensity |
Per-pixel \(I_\star(x, y)\) map |
API: Use compute_raw_contrast_curve() for
the full curve, or access the interpolator via coro.raw_contrast(separation).
from yippy.performance import compute_raw_contrast_curve
seps, contrasts = compute_raw_contrast_curve(coro, aperture_radius_lod=0.7)
# Or use the interpolator:
C = coro.raw_contrast(8.0) # raw contrast at 8 lam/D
API: Use compute_core_mean_intensity_curve()
for the full radial profile per stellar diameter, or access the stored
interpolator via coro.core_mean_intensity(separation, stellar_diam).
from yippy.performance import compute_core_mean_intensity_curve
seps, intensities = compute_core_mean_intensity_curve(coro)
# intensities is a dict: {stellar_diam: array}
# Or use the interpolator:
cmi = coro.core_mean_intensity(8.0, stellar_diam=0.0) # at 8 lam/D, point source
Nomenclature: “Core Mean Intensity”
The name core mean intensity originates from EXOSIMS, where the
radially averaged stellar intensity profile is stored as
core_mean_intensity.fits (generated by
process_opticalsys_package).
Other tools use different names for the same quantity:
Tool |
Variable Name |
Description |
|---|---|---|
EXOSIMS |
|
Radial average of stellar intensity map, stored as 1D curve |
AYO |
|
Raw 2D stellar intensity map (not radially averaged), indexed per pixel |
pyEDITH |
|
Same as AYO: raw 2D map from YIP |
yippy |
|
Radial average, matching EXOSIMS convention |
Despite the name, it is not computed within a photometric aperture (“core”). It is the azimuthal mean of the full 2D stellar intensity map at each separation. The “core” qualifier reflects how the value is used in the ETC (\(\bar{I}_\star \cdot \Omega\), where \(\Omega\) is the core area), not how it is computed.
Note that AYO and pyEDITH work directly with the 2D Istar map and
look up the per-pixel value at the planet’s position, while EXOSIMS
and yippy use the radially averaged 1D profile.
/home/docs/checkouts/readthedocs.org/user_builds/yippy/envs/stable/lib/python3.12/site-packages/tqdm/auto.py:21: TqdmWarning: IProgress not found. Please update jupyter and ipywidgets. See https://ipywidgets.readthedocs.io/en/stable/user_install.html
from .autonotebook import tqdm as notebook_tqdm
Coronagraph: eac1_aavc_2d (Amplitude Apodized Vortex Coronagraph, generated by Susan Redmond)
IWA: 4.26 λ/D, OWA: 32.00 λ/D
Contrast Measurement Animation#
Raw contrast requires measuring flux in the same aperture in both the off-axis (planet) PSF and the on-axis (stellar) PSF. The animation below shows the full-frame images (top), zoomed views around the photometric aperture (middle), and the contrast curve building up (bottom).
All images share the same color scale (set by the planet PSF peak) so you can visually see how much fainter the stellar leakage is – this difference is exactly the raw contrast.
Raw Contrast Curve#
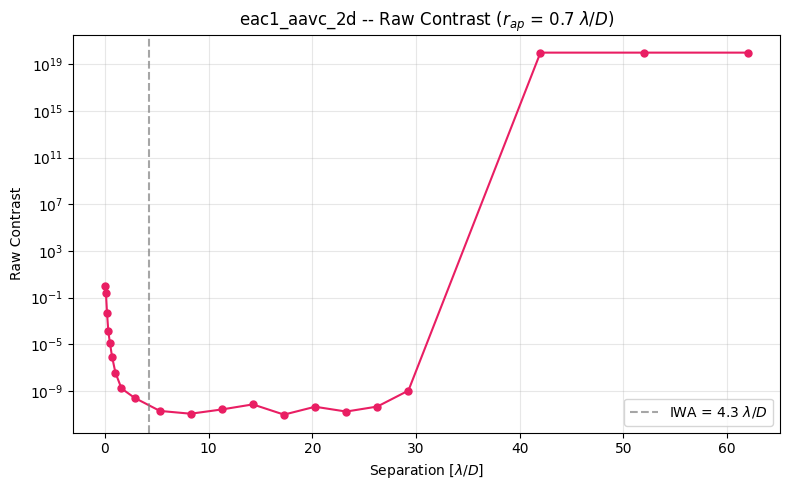
Contrast range: [9.24e-12, 1.00e+20]
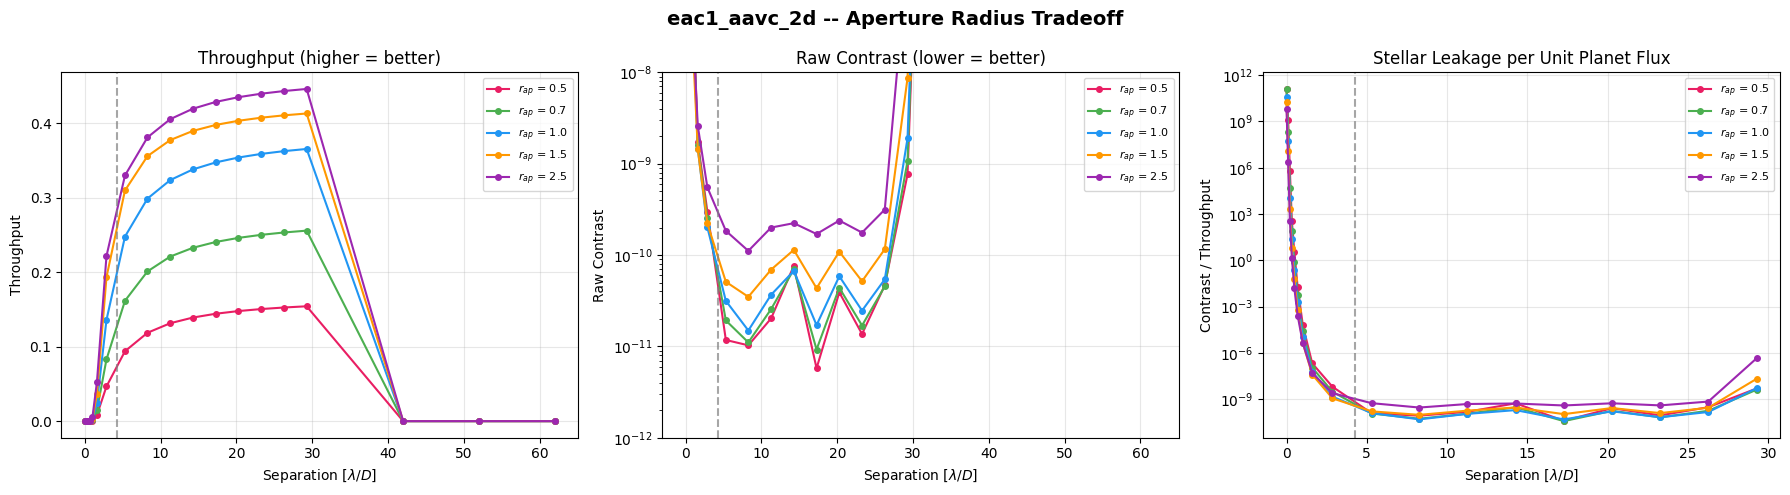
Contrast vs Aperture Radius#
/tmp/ipykernel_734/2337853976.py:18: RuntimeWarning: divide by zero encountered in divide
ax_ratio.semilogy(s, con / t, 'o-', ms=4, color=c, label=f'$r_{{ap}}$ = {r}')
Core Mean Intensity#
Core mean intensity \(\bar{I}_\star(r)\) is the azimuthally averaged stellar intensity at separation \(r\). It is computed by taking the radial profile of the on-axis (stellar) PSF – averaging the intensity in concentric annuli centered on the star.
This metric is used by EXOSIMS (primary method) and AYO/pyEDITH for computing the stellar leakage count rate. Unlike raw contrast, it does not depend on an aperture choice.
Radial Profile Animation#
The animation below shows how the radial profile is measured: an annulus sweeps outward through the stellar PSF, and the mean intensity in each annulus builds up the \(\bar{I}_\star(r)\) curve.
Effect of Stellar Diameter#
The core mean intensity depends on the angular diameter of the host star. Larger stars produce broader stellar PSFs, which can leak more light into the dark hole. The animation below cycles through the available stellar diameters, showing how both the stellar PSF and the radial profile change.