Noise Floor Conventions#
The noise floor represents the systematic limit on coronagraphic PSF subtraction – the residual stellar speckle noise that cannot be removed with longer integration time. Different exposure time calculators package this quantity differently.
Yippy provides both conventions so it can serve as a data source for any downstream ETC.
Two Conventions, Same Physics#
All ETCs produce the same final noise-floor count rate. The question is how the intermediate value is stored:
Whether the \(\Omega / (\theta_{\text{pix}}^2 \cdot \eta_p)\) factor is baked into the stored value or applied by the consumer distinguishes the two conventions.
AYO / pyEDITH Convention (per-pixel)#
AYO and pyEDITH store the noise floor in per-pixel intensity units:
The ETC scales to the full aperture:
This convention keeps the noise floor in the same units as \(\bar{I}_\star\), making it natural for 2D map indexing.
EXOSIMS Convention (contrast-normalized)#
EXOSIMS has two code paths for computing stellar residuals in
OpticalSystem.Cp_Cb_Csp_helper:
Standard path (when
core_mean_intensityis provided): Uses the 2D stellar intensity map, supporting stellar-diameter-dependent leakage:\[\text{core\_intensity} = \bar{I}_\star(r, d_\star) \cdot \frac{\Omega}{\theta_{\text{pix}}^2}\]Fallback path (when
core_mean_intensityisNone): Uses the simplercore_contrastcurve, which has no stellar diameter dependence:\[\text{core\_intensity} = C_{\text{raw}}(r) \cdot \eta_p(r)\]
For a point source these are algebraically equivalent, since \(C_{\text{raw}} = \bar{I}_\star \Omega / (\theta_{\text{pix}}^2 \eta_p)\). The advantage of the standard path is that it can model how stellar leakage increases with stellar angular diameter.
Yippy’s noise_floor_exosims computes \(C_{\text{raw}} / \text{ppf}\),
which corresponds to the fallback convention:
The ETC recovers the count rate by multiplying by throughput:
This convention is natural for 1D radial curves where throughput is a separate interpolated quantity.
Algebraic Equivalence#
The two conventions differ by a geometric factor:
When plugged into their respective ETCs, both produce identical noise-floor count rates.
import matplotlib.pyplot as plt
import numpy as np
from yippy import fetch_yip
from yippy import Coronagraph
import logging; logging.getLogger("yippy").setLevel(logging.ERROR)

yip_path = fetch_yip("eac1_aavc_2d")
coro = Coronagraph(yip_path)
print(f"Coronagraph: {coro.name}")
print(f"Pixel scale: {coro.pixel_scale_arcsec}")
print(f"IWA: {coro.IWA:.2f}, OWA: {coro.OWA:.2f}")
/home/docs/checkouts/readthedocs.org/user_builds/yippy/envs/stable/lib/python3.12/site-packages/tqdm/auto.py:21: TqdmWarning: IProgress not found. Please update jupyter and ipywidgets. See https://ipywidgets.readthedocs.io/en/stable/user_install.html
  from .autonotebook import tqdm as notebook_tqdm
Coronagraph: eac1_aavc_2d
Pixel scale: 0.25 λ/D / pix
IWA: 4.26 λ/D, OWA: 32.00 λ/D
Comparing the Two Conventions#
API:
nf_exosims = coro.noise_floor_exosims(separation, ppf=30.0)
nf_ayo     = coro.noise_floor_ayo(separation, ppf=30.0)
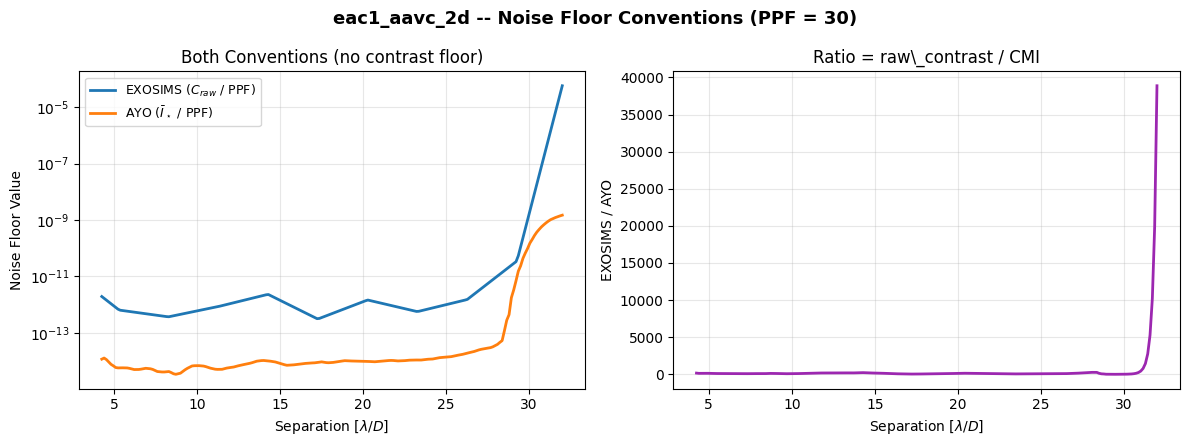
The ratio between the two conventions is not constant because
raw_contrast integrates stellar flux within a circular aperture
while core_mean_intensity is the azimuthal mean at each separation.
The relationship depends on the PSF structure.
Contrast Floor
By default, noise_floor_exosims clamps raw_contrast to a minimum
of 1e-10 (the contrast_floor parameter). In the working region
of most coronagraphs, the actual raw contrast may be far below this
floor, making the EXOSIMS noise floor appear constant. The plots
above use contrast_floor=0 to show the true underlying values.
Verifying Algebraic Equivalence#
We can verify the relationship by checking that the noise floor
ratio equals raw_contrast / core_mean_intensity, computed from the
individual yippy API calls:
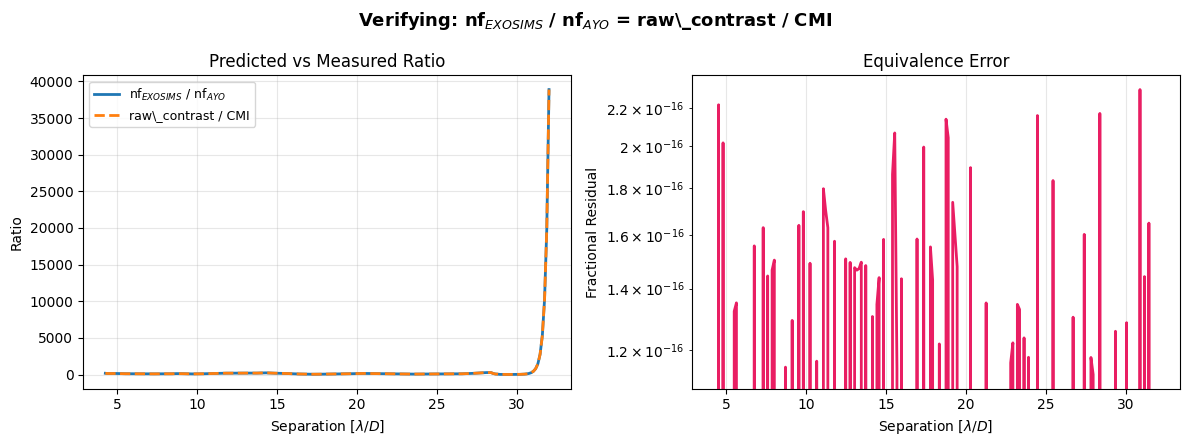
Max fractional residual: 2.30e-16
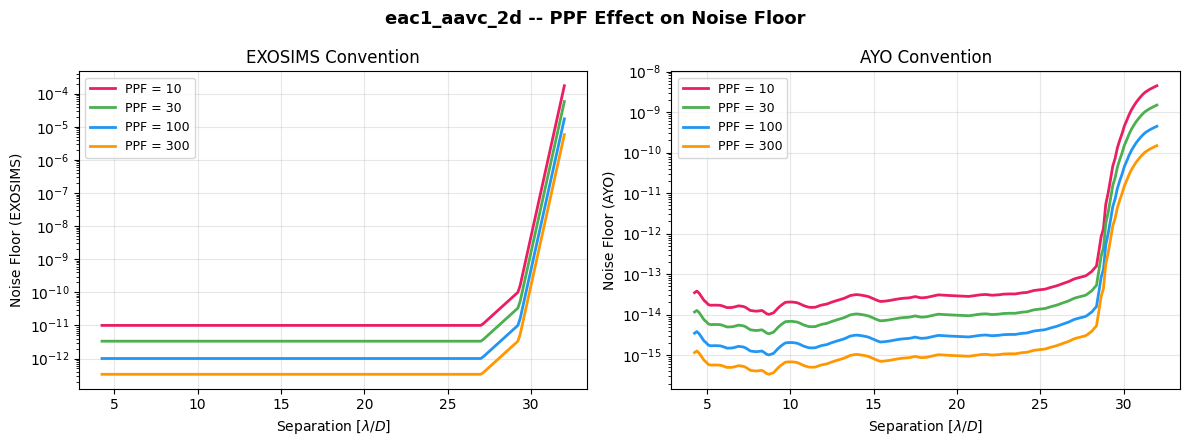
Effect of Post-Processing Factor#
The PPF sets the systematic noise floor level. A higher PPF means better speckle subtraction and a lower noise floor:
Which Convention to Use#
Consumer Code |
API Call |
Why |
|---|---|---|
EXOSIMS |
|
Matches |
pyEDITH |
|
Matches per-pixel |
AYO benchmarking |
|
Direct comparison with AYO CSV values |
Quick SNR estimate |
|
Contrast-level value is more intuitive |
References#
AYO noise floor:
load_coronagraph.proL582-584 (noisefloor = Istar / noisefloor_PPF)pyEDITH noise floor:
coronagraphs.pyL754-755 (Istar / PPF)EXOSIMS
C_sr(Prototype):OpticalSystem.pyL2143-2145 (core_mean_intensity * Omega / platescale**2)EXOSIMS
C_sp(Prototype): L2028-2030 (C_sr * ppFact * stabilityFact)EXOSIMS
C_b(Nemati):Nemati.pyL184-196 – adds RDI factorsk_SZandk_detthat scale backgrounds based on reference star differential imaging parametersStark et al. (2025) – Cross-Model Validation of Coronagraphic ETCs